With the growth in popularity of big data, data science and analytics, tools like Qlik, Cognos, Tableau and Power BI give the impression that Business Intelligence (BI) software are relatively new. However, as long as businesses have been around, BI has been an important topic. In fact, Qlik has been offering software to visualize data since 1993 and Tableau came along 10 years later. Not wanting to miss out, Microsoft released its Power BI product in 2011. Cognos, an independent corporation, was purchased by IBM in 2008, and has since labeled its BI tool by the same name. BI and the tools in support of BI, aim to display the data necessary for decision making. These tools fall under a large umbrella. A simple excel sheet qualifies as a BI tool the same way a beautiful Tableau dashboard does. Let’s take an in-depth look at these tools.

The question is not “Which one is best?’ rather “Which one is best for me”
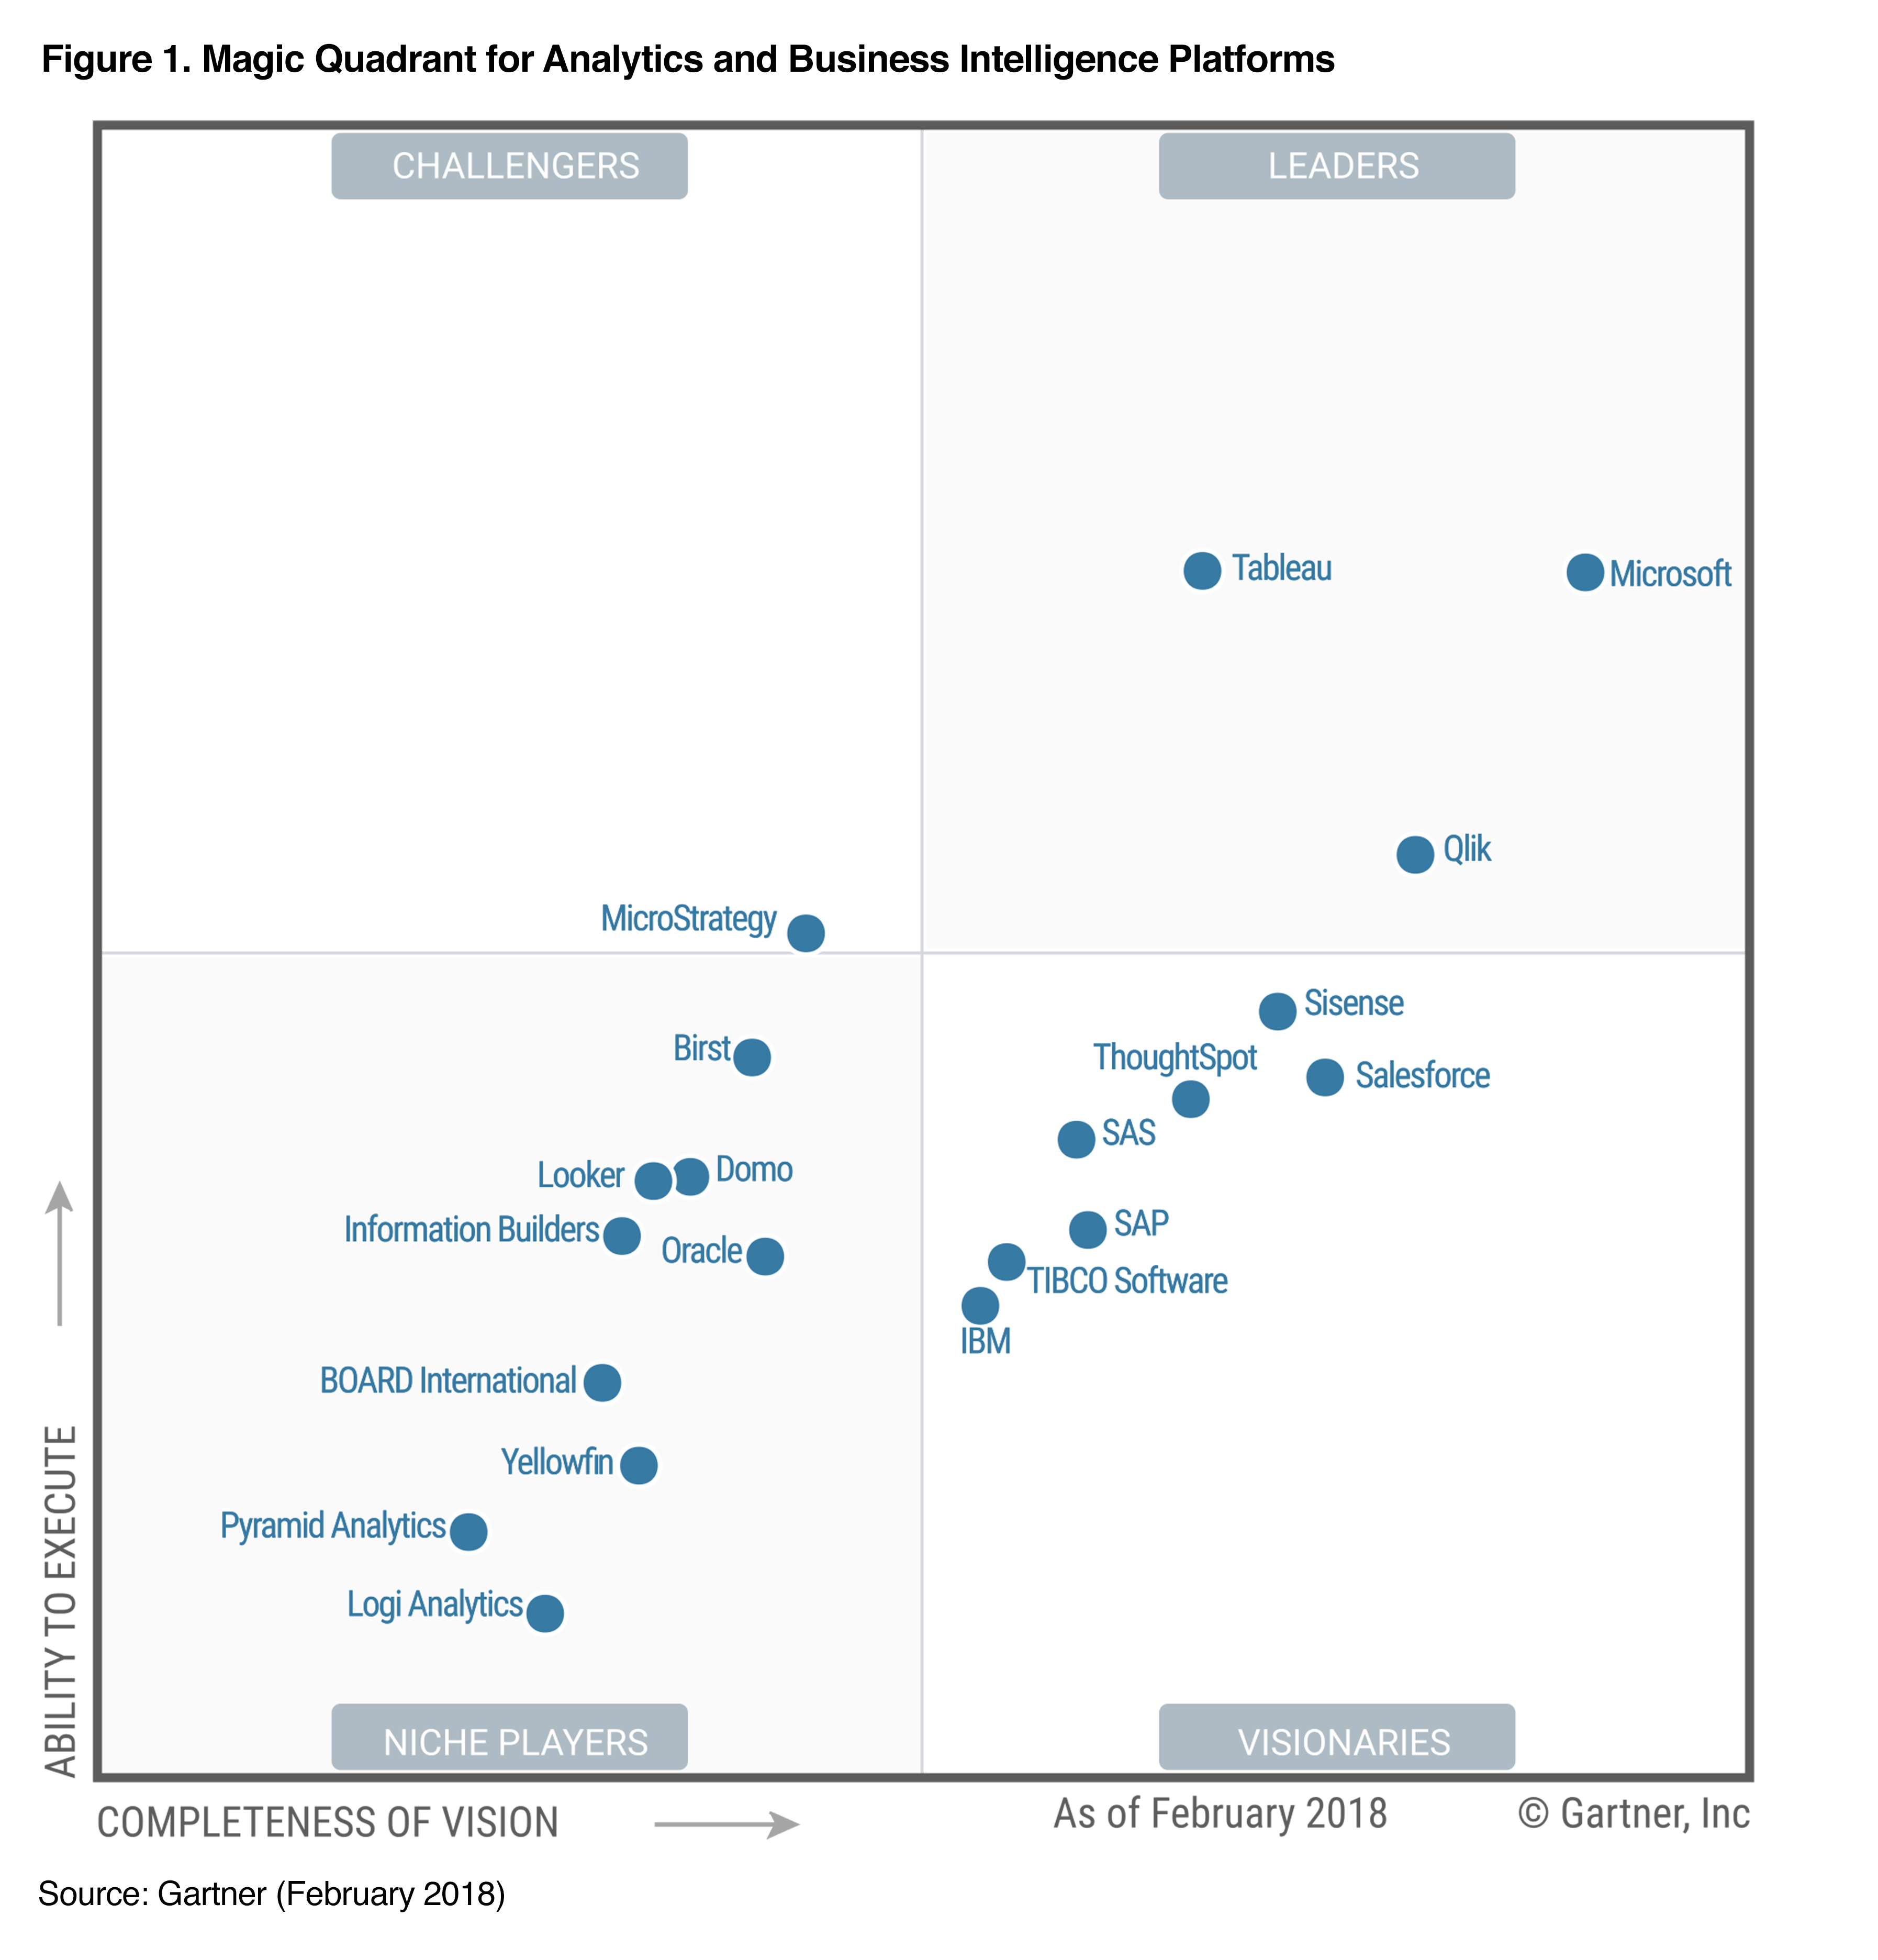
Which BI tool finds the right mix of functionality, usability and cost savings? According to the Gartner magic Quadrant, Tableau, Qlik and Microsoft are leaders in the space. IBM falls in the middle of the pack, relying mostly on its Watson product to gain visionary status. Other Niche players fill out the quadrant and are specific to industries or use cases.

COST
In the same way BI has been at the forefront of a business, so has reducing costs. Which tool is best for you depends on a few factors, the most important of which may be cost. Microsoft Excel is included with Office 365 which makes it the most cost-effective solution. Its add on product, PowerBI, is slightly more expensive at $9.99/month per user. Qlik’s offering is $16.99/month per user with similar features and feel of PowerBI. Tableau is a step up in cost with a required “Creator’ license at $70/month and additional “Explorer’ licenses at $35/month. For business users who just need to interact with, but not create visualizations, “Viewer’ licenses are $12/month, but a minimum of 100 is required. All prices are per user. Finally, Cognos is the priciest solution at $79.99/month per user. IBM’s focus is on the enterprise and requires a minimum of 25 licenses for Cognos.
Functionality
Despite appearing in the same magic quadrant, these tools vary wildly in functionality. Tableau aims to be an end to end solution. It combines the ability to do data wrangling, cleaning and prep in one tool. Once the data is ready, the charts, graphs and dashboards nearly build themselves. Further, Tableau has a wide network of user’s groups and even a yearly conference where some of the worlds biggest corporations show how they are leveraging the power of Tableau. In 2017 they had over 12,000 attendees.
Cognos is the most similar tool to tableau but is aimed at a more technical user. It requires data to be extensively cleaned and prepped prior to use. The Cognos interface can feel less intuitive and even has a gimmicky feel to it. Enterprises who already use an IBM stack may find this the best tool to use.
For functionality, Excel, Power BI and Qlik can be evaluated together. Before opening these tools, it’s necessary to prepare your data. Heavy lifting needs to be done to organize and clean prior to connecting to a visualization tool. Qlik does have a small network of user’s group as well as a yearly conference. Attendance at last year’s conference was announced at 5,000.

The Future
There is certainly no shortage of players entering and exiting the space. Looker and Sisense are two examples of tools that have a spot in the market. It remains to be seen if they will be niche players or will grow to compete with current leaders. However, at present, Tableau is adding new features and products and has an incredible network of user groups. Qlik has unfortunately gone though multiple rounds of layoffs and there is no clear direction on the future of the company. Recently, it met resistance when trying to migrate users from QlikView to QlikSense. Microsoft, and its Power BI offering is a cheap alternative that may begin to grow based on the power of the Microsoft brand and Office 365 alone. However, Power BI has similar limits and shortages that Qlik does.
Another way to look at these tools is to see which companies are using them. In the past, roles like DBA or Data Modelers was a sought-after skillset. With the invention of the cloud and cheaper data storage, those roles have now become niche. You might be able to argue that reporting developers may soon be in the same boat. A quick search of job descriptions in Richmond shows 143 job postings with the keyword “Tableau’, vs 35 with Cognos, Qlik and Power BI combined. Austin, Texas, a growing tech hub of the US shows a similar discrepancy with 355 vs 57. As outlined thus far, Tableau is a more sought-after skill with a wider network of users. It’s possible that the delicate balance of price point and processing power are driving that trend.
Evaluation
When evaluating any BI tool, it’s important to remember it’s just that, a tool. Some tools are better than others at cleaning and prep, but all the tools are designed to sit on top of a functional data warehouse. None of these tools are going to magically clean up your data. Once your data is ready for ingestion by a BI tool, you then need to ask yourself who is going to be the users of the tool? Will it be one user who is producing and distributing? Will you have users building their own visualizations? Do different users need different access to raw data? What is the level of technical expertise of your users.


Comments